04 December, 2011

Same, same...but different! Einstein, Planck and the role of science in society

  • process information to discuss Einstein’s and Planck’s differing views about whether science research is removed from social and political forces
Science is a powerful instrument. How it is used, whether it is a blessing or a curse to mankind, depends on mankind and not on the instrument. A knife is useful, but it can also kill.
Einstein                   

Max Planck (Nobel 1918)This 'dot point' from the NSW Physics Syllabus is at best woolly and ambiguous and at worst misleading because it seems to imply that a great gulf existed between Einstein and Planck when in fact they were lifelong friends and seemed to have much in common and a great respect for each other.

03 November, 2011

How Clean is Coal Seam Gas?

CSG Well (source: http://www.glng.com.au/ )
The rapidly expanding exploration and development of Coal Seam Gas (CSG) has inevitably led to conflict. Community concerns include alienation of agricultural land, potential impacts on water resources and the use of chemicals during ‘fracking’. On the other hand the Industry argues that CSG has the potential to earn the country significant export income, create jobs in regional areas and help us cut our greenhouse emissions. Advocates on both sides are enlisting the help of ‘science’ to support their arguments, but what does the science really tell us? We can’t deal with all of the potential issues in one program so today I just want to look at the claim that CSG is a ‘clean’ alternative to coal.
Those in favour of expanding the coal seam gas industry promote it as a green alternative to coal for use in power stations. They argue that coal seam gas, which is mainly methane, results in 70% less carbon dioxide emissions for the same amount of energy.

The 70 per cent figure relates to greenhouse gas generation at the power plant and comes from a comparison between a modern combined cycle gas turbine (CCGT) power plant and a traditional power station burning brown coal, which is the lowest grade of coal. If we make the comparison with a traditional plant burning higher grade black coal the difference falls to about 50%. If we make the comparison with a modern ultra-super critical coal plant the difference drops even further, though it is still significant.

But what happens at the power station is only part of the story. If we really want to know if CSG is greener we need to do a ‘cradle to grave’ comparison, that is, we need to look at greenhouse gas contributions from the coal deposit to the smoke stack. Coal is relatively easy and cheap to dig up and put on a truck and send to the power station. The energy input needed to mine and process the coal is about 2-3% of the amount of energy released by burning it. Coal seam gas is trickier. It needs to be captured, processed, compressed and transported at an energy cost of 20-25% of the energy that is released by burning it.

But the real villain in this story is fugitive emission. If we drop a few lumps of coal between the mine and the power station it is no big deal. But if we leak a bit of methane it’s a very big deal because methane is 20-30 times more potent as a greenhouse gas than carbon dioxide (methane breaks down more rapidly in the atmosphere than carbon dioxide and is about 25 times more potent as a greenhouse gas over a 100 year period, but over a 20 year period methane is over 70 times more potent than carbon dioxide). These leaks are known in the industry as ‘fugitive emissions’ and while the CSG industry argues that they are negligible, the truth is that there doesn’t seem to be any good published data on fugitive emissions from CSG in Australia. The most similar data we have at present comes from a paper by Robert Howarth on fugitive emissions from shale gas production in the United States. Howarth estimated fugitive emissions of 4‑8%. But shale gas production is not the same as CSG production, and to be fair there is also some leakage of methane from coal mining operations (just ask the canaries), but if the rate of leakage for CSG was comparable to that reported by Howarth, then it would be more than enough to wipe out any greenhouse benefit from switching to coal.

To this complicated picture we need to add another very cruel irony. CSG is definitely cleaner than coal in the sense that it produces much lower amounts of sulphur dioxide and particulates which contribute to acid rain and smog. But sulphur dioxide and particulates reflect solar radiation and also help cool the planet. In other words, this pollution from coal may actually help fight global warming.

So you can see that the science is quite complicated. A recent article in the peer reviewed journal Climate Change by Tom Wigley from Adelaide University tried to put all these pieces together and found that a switch in power generation from coal to CSG would most likely result in an increased greenhouse effect out till about 2100 and only a negligible decrease after that.

So does this mean that CSGs future as a ‘green fuel’ is dead. Maybe not. There is a great deal of uncertainty about the level of fugitive emissions associated with CSG in Australia, and fugitive emissions are, in theory, controllable.  What we really need is some comprehensive independent scientific studies to give us the information to determine whether CSG really is the green transitional fuel we would all like it to be.

27 October, 2011

Space Junk

ROSAT-1 (source: http://www.dlr.de/ )
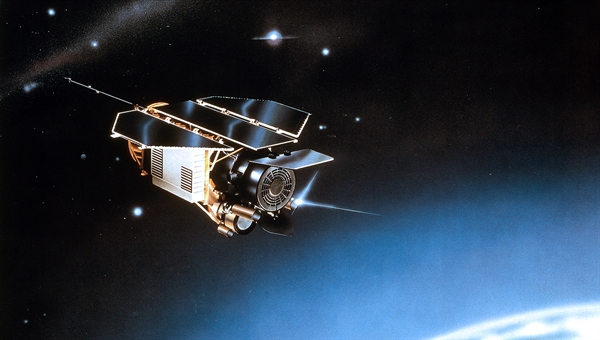
Last Saturday a large piece of space junk, the 2.4 tonne ROSAT satellite fell from the skies. Most of the satellite would have burned up as it sped through the atmosphere but many fragments, possibly totalling a tonne or more, may have crashed to Earth. Luckily, the satellite fell into the Bay of Bengal but it could have been very different. Two large Chinese cities lay just a little further along the satellite’s projected path. So how dangerous is space junk?

ROSAT was the second large satellite to fall to Earth in as many months. NASA’s 6 tonne UARS satellite fell into the southern Pacific Ocean in late September. It also broke up and may have spread fragments over an 800 km debris field. So far there have been no reports of debris sightings from either satellite.

Space junk is a term used to describe the millions of objects created by humans that are in orbit around the Earth but no longer serve any useful purpose. Most of these are smaller than 1 cm, particles like paint flakes and particulates from solid rocket fuels. These small fragments pose a problem for operating satellites because they can cause significant abrasion, rather like sandblasting, damaging mirrors, solar panels and other parts of the craft. But there are also tens of thousands of larger particles, including about 20,000 objects weighing more than 100 kg, and these are a real danger. According to the National US Academy of Sciences a 1 kg piece of space junk impacting at 10 km per second could destroy a 1000 kg spacecraft creating many more dangerous fragments in the process.

As pieces of space junk orbit the Earth, friction or drag from the upper atmosphere slows them down, and as they slow they are unable to maintain their orbits and begin to spiral downwards. Most fragments ‘burn up’ due to the heat created by friction as they speed through the denser lower atmosphere, but some satellites contain parts that are specifically designed to withstand high temperatures. NASA estimates that about 26 pieces of the UARS satellite, weighing a total of 530 kg, probably survived. And the ROSAT satellite had large ceramic mirrors and a carbon-fibre composite support structure which may have survived re-entry.

One of the things that often puzzles people is why scientists, who can accurately predict the paths of comets and other objects in distant outer space, have such a lot of trouble predicting when and where falling space junk will hit the ground. One factor that affects their trajectory is how they tumble and turn as they re-enter the atmosphere. Because satellites often have a very irregular shape, differences in how they tumble can have a big difference on the amount of drag as they fall.

Another important and difficult to predict factor is solar activity. Periods of high solar activity result in the Earth’s outer atmosphere warming and expanding, increasing the drag on satellites and making them fall to Earth more quickly. In fact we can probably expect a higher rate of space junk re-entry as we approach a solar maximum in 2013.

So should we all rush out and buy hard hats? Probably not. Since the 1990’s space agencies have adopted new procedures to decrease the threat from space junk including a move towards smaller satellites, and NASA assures us that it has no large satellites that will make an uncontrolled re-entry in the next 20 or so years. And while the risk of injury from the falling UARS craft was estimated by NASA to be 1 in 3000, and the risk from ROSAT about 1 in 2000, NASA and some foreign space agencies now seek to limit human casualty risks from reentering space objects to less than 1 in 10,000.  Indeed, despite all the space junk out there I can only find one credible report of injury. In 1969 five Japanese sailors were injured by an object that may have been space junk of Russian origin.

Maybe the sky isn’t falling after all.

19 October, 2011

Tectonic Disasters and Climate Change

Shih Gang Reservoir damaged by
earthquake (source: Wikimedia Commons)
Climate Change seems to get the blame for everything these days. My Earth Scientist colleagues sometimes respond to news of a cluster of earthquakes or volcanic eruptions by joking ‘It must be caused by climate change.’ Well, a recent article in New Scientist suggests that comments like these may not be so crazy after all (New Scientist 1 Oct 2011, p.38).
Tectonic disasters include volcanic eruptions, earthquakes and tsunamis. In a nutshell, these are all examples of the Earth’s crust responding to built up tension or pressure.

The Earth’s crust consists of dozens of tectonic plates, all moving in different directions. This movement causes pressure or tension to build up at the plate boundaries until it is released by movement along a fault, resulting in an earthquake.
Most volcanoes are also located near plate boundaries. Volcanoes erupt when the pressure from the molten rock or magma beneath the surface build up to the point that it can no longer be contained by the overlying crust.
Is it possible that tectonic activity could be influenced by climate change? Maybe, if there is ‘something’ that is influenced by climate and can significantly change the pressure on the crust. Well, that ‘something’ is water. Water is pretty heavy and climate change could move a lot of it around, redistributing the pressure on the crust.

Let’s look at a simple case. Many plate boundaries are near coastlines. Many plate boundaries also have high mountains with glaciers on the land side. If the glaciers melt, then this water moves from the land to the sea. Decreasing the load on the land and increasing the load in the sea puts stress on the plate boundary faults increasing the likelihood of an earthquake.

This loading and unloading can also affect volcanic activity. Removing ice cover decreases the pressure over the volcano. This in turn results in more rock melting and more magma being produced, increasing the pressure inside the magma chamber. The decrease in overlying pressure also means that the crust is less able to suppress the increase in magma making an eruption more likely.

It is not just melting ice that could have an effect. Seasonal phenomena like El Niño can result in regional changes in sea level of up to 50 cm which can also affect the pressures on the underlying plates. A recent study of earthquakes near Easter Island found a link between El Niño related changes in sea level and earthquake activity (Philosophical Transactions of the Royal Society A, vol 368 p.2481).

So how real is the risk. No one is suggesting that climate change is behind major recent disasters like those in Japan and New Zealand. Indeed, there is no evidence of a significant increase in earthquakes or volcanic activity over the last century. But the amount of warming we have experienced so far is small compared to what is predicted to come. At the moment these effects are mainly theoretical, but if global warming increases they could become very real.

15 September, 2011

2011 Pakastani Floods

2010 Pakastan Floods (source: Wikimedia Commons)
For the second year in a row heavy monsoonal rains have resulted in devastating floods in the Sindh region of Pakistan. Today I want to look at the efforts of scientists to understand the causes of these floods because if we can understand the causes we may be able to predict heavy rainfall events 5 to 10 days ahead then the authorities can prepare by lowering dam levels and taking other precautions to lessen the impacts
We have known for since the work of Sir Gilbert Walker in the early 1900’s that there is a strong link between the El Niño climate phenomenon and the Asian monsoon. During a La Nina event, which is an anti-El Niño , water temperatures in the western Pacific Ocean are relatively warm and this feeds warm, moist air into the Asian Monsoon resulting in heavy rains in India and Pakistan.  The index we use to gauge this weather pattern is the ENSO index and it currently shows a falling trend just like that in Aug 2010.

El Niño  is a Pacific Ocean phenomenon, and while it is the major seasonal influence on the Monsoon we are beginning to appreciate the significance of a similar seasonal phenomenon that operates in the Indian Ocean called the Indian Ocean Dipole. A positive dipole indicates warm water in the western Indian Ocean relative to the east, and these warmer waters also feed the monsoons in India and Pakistan. It is quite rare to get a La Nina and a positive Dipole event at the same time but this is what happened in 2010 and seems to be happening this year.

Both La Nina and the Dipole are seasonal influences, but there is another influence that operates on a shorter timescale called the Madden-Julian Oscillation. This is a 20-40 day cycle of alternating high then low rainfall that starts in the Western Indian Ocean and progresses eastwards to the Pacific.

So knowing all of this, are floods like those we have seen in Pakistan predictable?  In February this year Peter Webster and colleagues from the School of Atmospheric Science at Georgia Tech published a paper in the journal Geophysical Research Letters. They took data on these phenomena and plugged them into a weather forecasting model developed by the European Centre for Medium Range Forecasts. They used this model to make predictions of July-August rainfall in Pakistan for the years 2007 to 2010 and found they could reliably predict the high rainfall events 6 to 8 days ahead of time. This is just one study over a relatively short period of time, but if their technique proves reliable and, importantly if it can be used in conjunction with hydrological models which predict the behaviour or rivers after the rain falls, then this could be really useful ‘advanced warning’ that would allow the authorities to manage flood events.

One last point to note is that there has been a significant increased frequency of these major flooding events in the last 30 years in a way that is consistent with what we would expect as a result of general global warming.